
Data that can identify and flag bonus abuse, and that can pick out unusual trends that may indicate fraudulent use, are just two of the extensions that established APMs can provide; beyond the basic ‘Know Your Customer’ analysis. Identifying digital wallets where abusive behaviour is evident and can be addressed allows operators to optimise the use of the desired services with confidence. To achieve a good level of confidence, digital wallets data needs to be shared openly and integrated into account management reports.
Immature data is of limited value, but deep mature data can be used in four distinct ways:
To inform client proposition enhancementsTo indicate fraudulent activity and adverse KYC analysisTo identify and block bonus abuseAdd insight to promotional opportunities and communication strategies
The irony of providing best-in-class fraud and bonus abuse data is that anecdotally it frequently translates into poor trust scores on public trust measurement sites, as there are no wholesale filtering capabilities in the trust sites to exclude scores and comments posted by fraudulent and bonus scheme abusers; those who have suffered at the hands of the data indicators. Those APMs with lower trust scores may perversely be the ones that are providing the industry with the best service standards, and this is indeed the picture that emerges when internally collated client satisfaction survey data is included.
No payment scheme provider, whether established mainstream, or alternate, will share their backroom algorithms in detail, as this would undermine the integrity of the process, but some are more transparent than others at making a virtue of openness on the data they collect and why.
There is a mix of factual and behavioural data collection, the factual data being used initially to satisfy the KYC regulatory requirements, with the behavioural data being positioned more at the intelligent analysis; which is where the volume and depth of mature data points will dictate the value of outputs.
The factual data elements check predictable aspects such as addresses, credit histories and the like; but it’s the interpretation of the behavioural data that has particular relevance to operators.
The behavioural data is captured from:
The time of the registration processThe patterns of time in each step of account registrationThe metadata in the image sent as proof of identification compared to other uploaded dataThe tech formats of POA-POI (to expand on)The pattern and frequency of loading value, with volume and velocity parametersThe pattern of playBehaviour of spend over time, across value and merchants spent at
By drawing on these elements and combining the outputs, patterns emerge to indicate:
Volume Value Velocity indicators to spot fraud and create actions to be takenPredictions of behaviour that triggers positive and preventative actionsPlayer behaviour indicates a clear pattern of regular use across different sites at different times, and depending on their wins and offers switch operatorsBehaviour that is recognisable as fraud/criminal activity and can be stopped in real-timeOnboarding behaviour and use of documents/type that indicates potential criminal/fraud risk and steps created to stop, increase risk requirementsPatterns of behaviour matched to external influences: weather, seasonal occasions and disruptions. Covid-19 is an obvious influence!
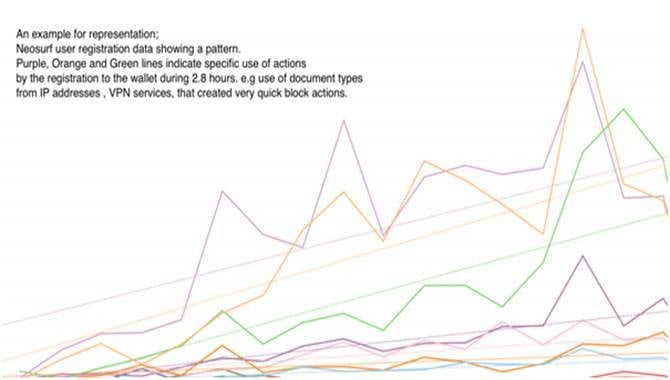
In this case, the blocks were created, stopping a number of activities. But even more importantly the use of the data was added to the analysis to establish insights. These insights were then shared with specific operators so together a proactive plan of action can be put in place.
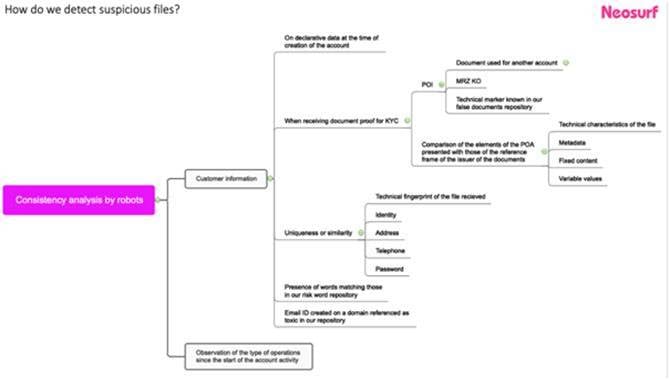
This extract of a very complex system shares some insight into a high-level process of looking for consistencies. The data output of this and further deep actions is a sustainable approach to match behaviours to ongoing registrations by geography, time, values etc. The use of the analysis is key internally, but sharing the analysis is even more valuable to partnerships with operators.
Industry commentators emphasise the value of providing operators with quality, mature data. Client satisfaction levels with the overall service proposition, indicate quarterly trend data running at between 95% and 98%, highlighting not only the responsiveness of the customer care team but, equally importantly, the underlying platform capabilities driven by the data analytics.